Health allows you to see at a glance how things are going based on a traffic light system
(RAG - Red, Amber, Green), so you can identify if things are going well or falling behind schedule.
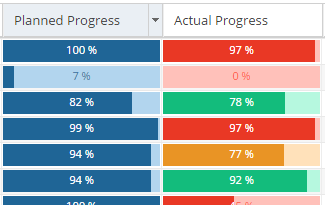
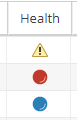
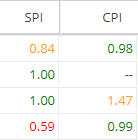
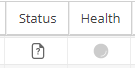
You will see the health colours used in Actual Progress, columns showing Health or the SPI / CPI values:
 |
 |
 |
How Health is Calculated:
-
Health Reason Example Grey
(Not Started)In Backlog (not Planned)
Belongs to an Unpublished Schedule
Planned Start Date is in the future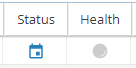
Blue
(Closed)Task is Completed 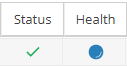
Task is Cancelled 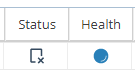
Orange
(Alert)SPI < 0.9 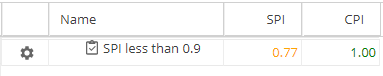
If SPI shows as --
Behind Schedule but Today's Date < Task Planned End Date
and Actual Progress is between 60-90% of the Planned Progress %
Red (Late) SPI < 0.6 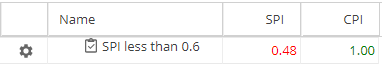
Today's date > Planned End Date
*Note: Even if Actual Progress is 100% but the Task has not been marked as
Completed, it will show as Red (Late) if the planned end date has passed.
If SPI shows as --
Very Behind Schedule if Today's Date < Task Planned End Date
and Actual Progress is < 60% of the Planned Progress %Green
(OK)Running On Time (or ahead of Schedule)
If the planned end date has not passed and Actual Progress is within 10% of the
Planned Progress % (or if none of the conditions above have been met).
-
Health Reason Grey Project is Draft Schedule is Unpublished Blue Project is Closed Schedule is Closed Orange SPI < 0.9 If SPI shows as --
Behind Schedule but Today's Date < Schedule Planned End Date
and Actual Progress is between 60-90% of the Planned Progress %Red (Late) SPI < 0.6 If SPI shows as --
Very Behind Schedule if Today's Date < Schedule Planned End Date
and Actual Progress is < 60% of the Planned Progress %Green Planned Progress is 0% and Project is Live / Schedule is Published Running On Time (or ahead of Schedule)
If the planned end date has not passed and Actual Progress is within 10% of the
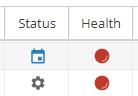
Planned Progress % (or if none of the conditions above have been met).Examples of Project Health:
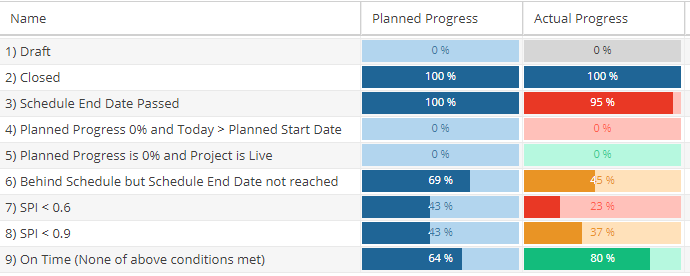
Examples of Schedule Health: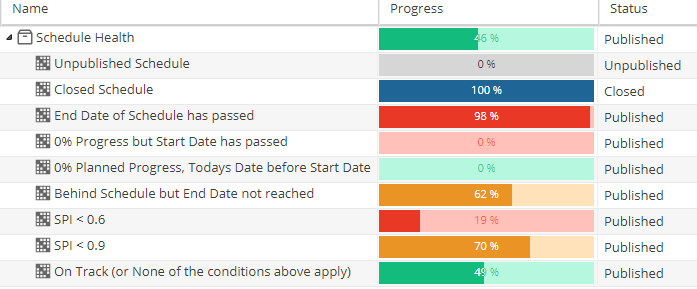
-
SPI and CPI will be found on the Costs tab (for PMO > Projects or Project > Schedules for either List or Detail view) or included in Report Widgets.
SPI
SPI = EV ÷ PVEarned Value (EV)
Total Hours Required x Actual ProgressPlanned Progress (PV)
Planned Effort / Total Hours Required
Health Colour Coding: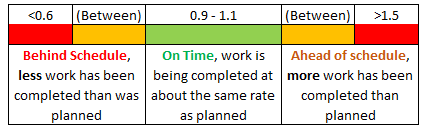
Read more about SPI hereCPI
CPI = EV ÷ AC
Health Colour Coding: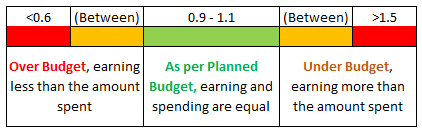
Read more about CPI here -
Actual Effort (h) / (Actual Effort (h) + Remaining Time (h))
These values can be found on the Project > Schedules > Schedule Details > Progress tab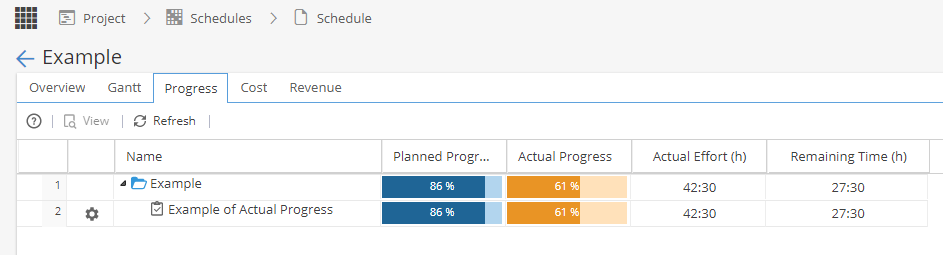
Looking at this screenshot as an example:
Actual Effort (h) / (Actual Effort (h) + Remaining Time (h))
42.5 / (42.5 + 27.5)
42.5 / 70 = 0.61 (Rounded to 2 Decimal Places)
0.61 = 61%
Where Health is visible:
-
PMO > Projects > Progress Actual Progress Reports > Company Dashboards > Tabular View Widget Real Progress Reports > Project Dashboards > Tabular View Widget Real Progress Reports > Company Dashboards > Project Progress (Data Table) Actual Progress Reports > Project Dashboards > Project Progress (Data Table) Actual Progress -
Project > Schedules > Schedules List > Progress Actual Progress Project > Schedules > Schedule Detail > Progress Actual Progress Reports > Project Dashboards > Schedule Progress Widget Actual Progress -
Project > Schedules > Schedule Detail > Progress Actual Progress Project > Risk > Process Health Project > Deliverables > Process Health Project > Issues > Process Health -
-
Reports > Company Dashboards > Tabular View Widget (Item: Deliverable) Real Progress Reports > Project Dashboards > Tabular View Widget (Item: Deliverable) Real Progress Project > Risks > Risk Process Health Project > Schedules > Schedule Detail > Progress Actual Progress -
Reports > Company Dashboards > Tabular View Widget (Item: Deliverable) Real Progress Reports > Project Dashboards > Tabular View Widget (Item: Deliverable) Real Progress Project > Deliverables > Deliverables List Progress Project > Deliverables > Deliverable Process Health Project > Schedules > Schedule Detail > Progress Actual Progress -
Reports > Company Dashboards > Tabular View Widget (Item: Issues) Real Progress Reports > Project Dashboards > Tabular View Widget (Item: Issues) Real Progress Project > Issues > Issues List Progress Project > Issues > Issue Process Health Project > Schedules > Schedule Detail > Progress Actual Progress -
Project > Schedules > Schedule Detail > Progress Actual Progress Project > Tasks > Task List Health Project > Tasks > Task Details > Overview Progress Reports > Company Dashboards > Milestones Widget Health Reports > Project Dashboards > Milestones Widget Health -
Project > Schedules > Schedule Detail > Progress Actual Progress Project > Tasks > Task List Health Project > Tasks > Task Details > Overview Progress Reports > Company Dashboards > Checkpoints Widget Real Progress Reports > Project Dashboards > Checkpoints Widget Real Progress -
*Budget Health is calculated by evaluating the actual budget vs. the planned budget.Reports > Company Dashboards > Project Portfolio Summary Widget (Group: Budget Health) Over / Under budget Project > Finances > Budget Cost / Revenue Values
-
Timesheets List Time Log Detail List of Tasks Task Detail Deliverables List Deliverable Detail List of the Deliverable life cycle Task Health Filter Deliverables Health Filter Approval List *Health based on deadline of each approval level Read more about the API here