- For all Projects:
PMO > Projects > Costs - CPI column (Cost Performance Index) on far right hand side. - For all Schedules in a single Project:
Project > Schedules List > Cost - CPI column (Cost Performance Index) on far right hand side.
CPI = EV ÷ AC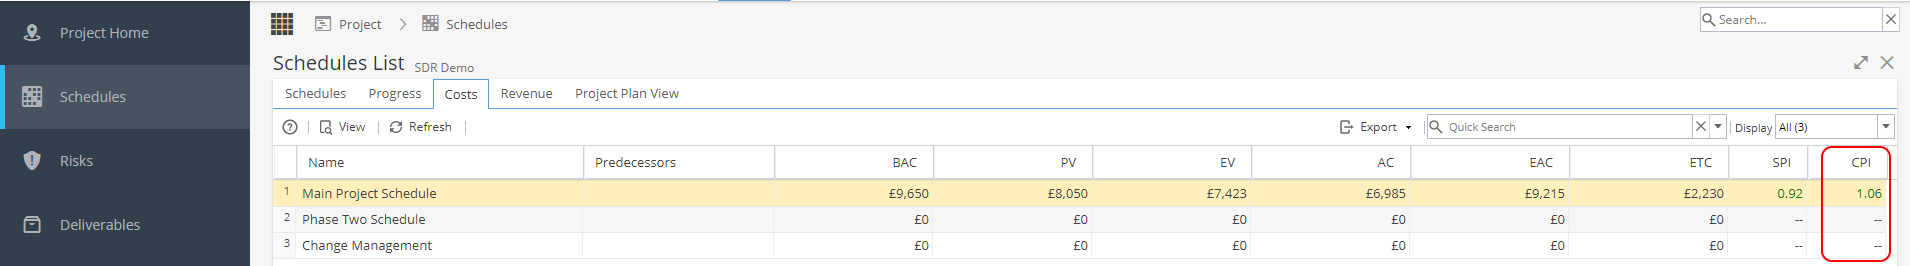
- For all Tasks in a single Schedule
Project > Schedules > Schedule Detail > Costs
Click on the arrows to left of Name to expand to drill down to Task level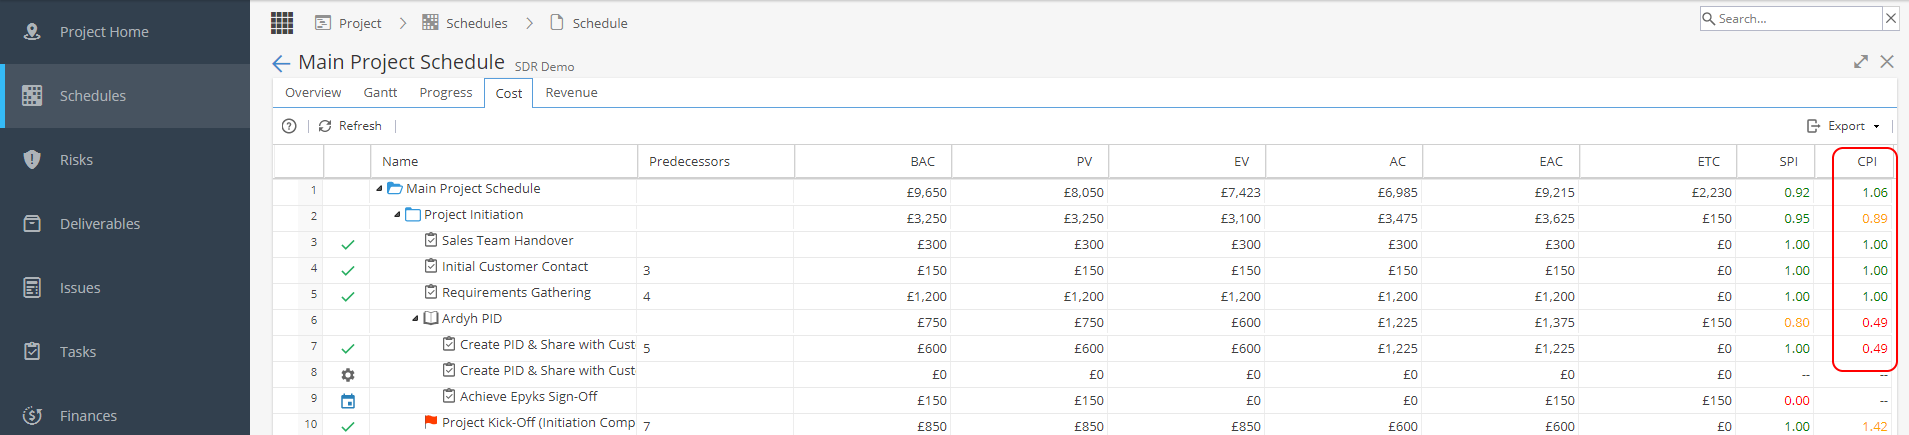
- Project Portfolio Summary report widget for Company Dashboards
This can show CPI (Cost Performance Index) or CVI (Cost Variance Index)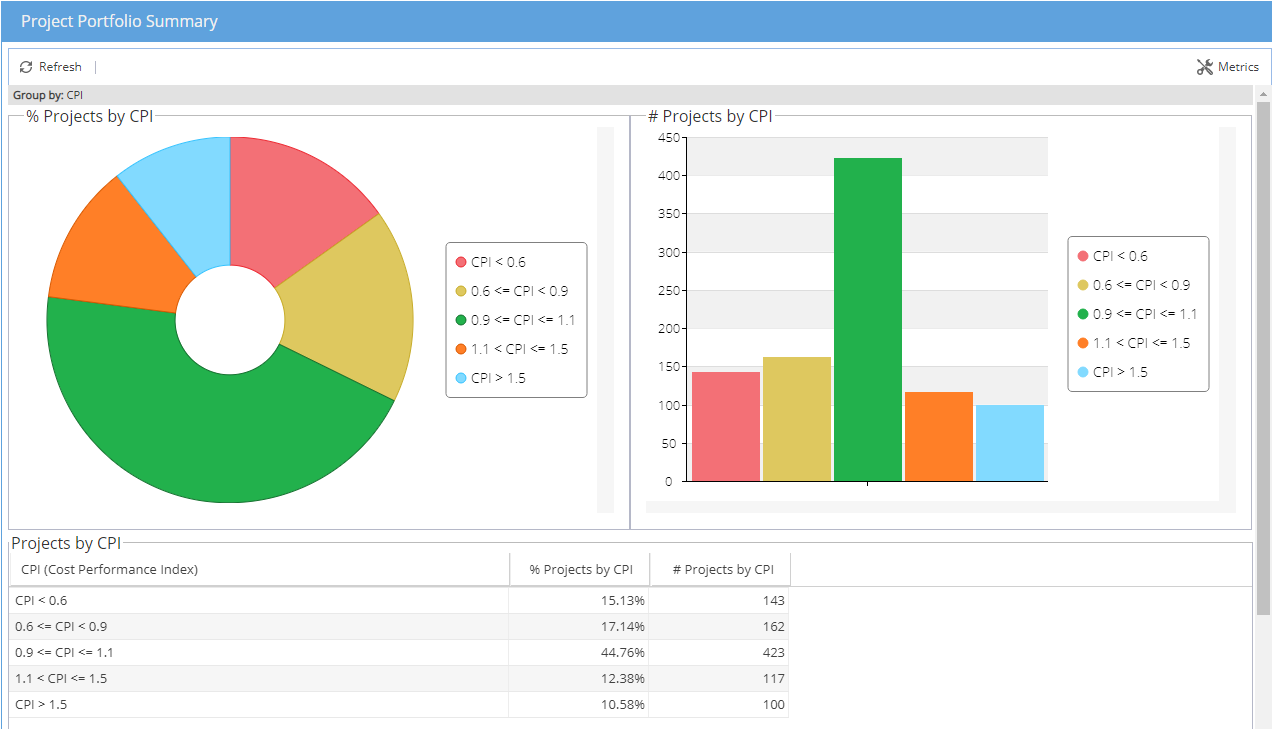
- Project Effort and Cost Summary report widget for Company or Project Dashboards
Looking at the Cost view will show the % Cost Deviation
- Project Progress report widget for Company or Project Dashboards
With the view set to show cost and then Planned / Actual values.
This will take a weekly snapshot of Cost values - Project Comparison report widget for Company Dashboards
The Data table view can include CPI traffic lights or you can compare EV to AC - If using BI there may be the option to include this in your reporting.
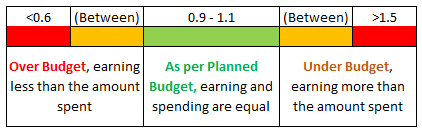
CPI Colour Coding: