The PMO > Forecast screen displays the planned and actual values for cost and / or revenue for Projects and Non-Project Tasks over a 6 month period.
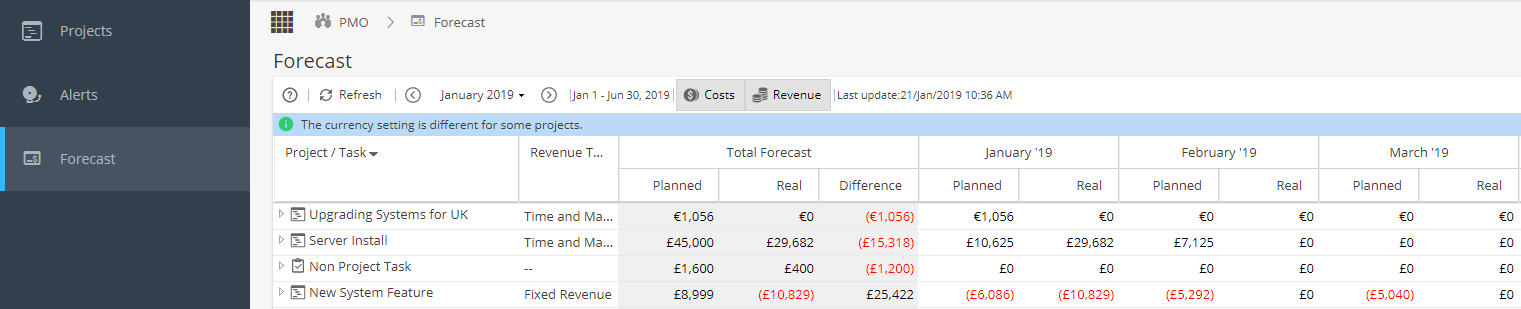
Select Date Range
The view will always show the Total for the Project / Non-Project Task along with a breakdown for 6 months.
Use the calendar to select the first Month to display or the arrows to jump forward / back by 6 month intervals.
Costs & Revenue
Use the Costs / Revenue buttons to toggle the display to show one or both options:
If displaying both, you can click on the arrow to the left of the Project / Non Project Task to expand the breakdown: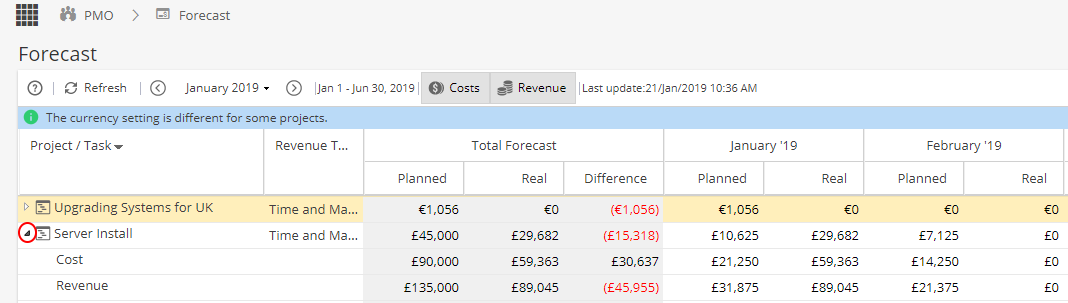
Update Forecast
The Update Forecast allows the system to update the revenues and cost by clicking Update Forecast button it will show the recent value.
(Note: The refresh button will only update the page view but the Update Forecast button pulls through any changes on the Projects / Non-Project Tasks that will affect this screen)
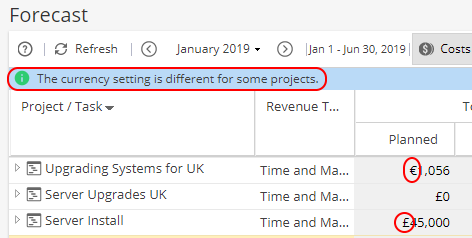
If the system detects an incomplete value which could affect the forecast results, it will flag up the Project / Task with a warning triangle. Hover the mouse over this for further details.

A message will appear at the top if Projects have different Currencies as a reminder when doing comparisons.
Filter Options
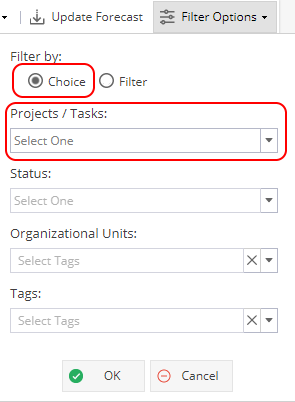
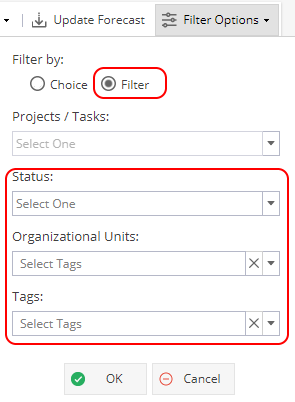
The Filter Options allows the user to filter via 2 options:
Choice - Only filters by Project Name
Filter - Status, Organisational Units and Tags
Note: The Organizational Units and Tags are based on the options configured for your Company.
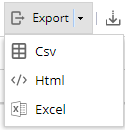
Exporting
The Forecast table can be exported; select your preferred format and confirm the year to export:
To see a similar view for a single project, look at Project > Finances > Cash Flow